Practical Exercise: Min-Max Contrast Stretching
The Scenario:
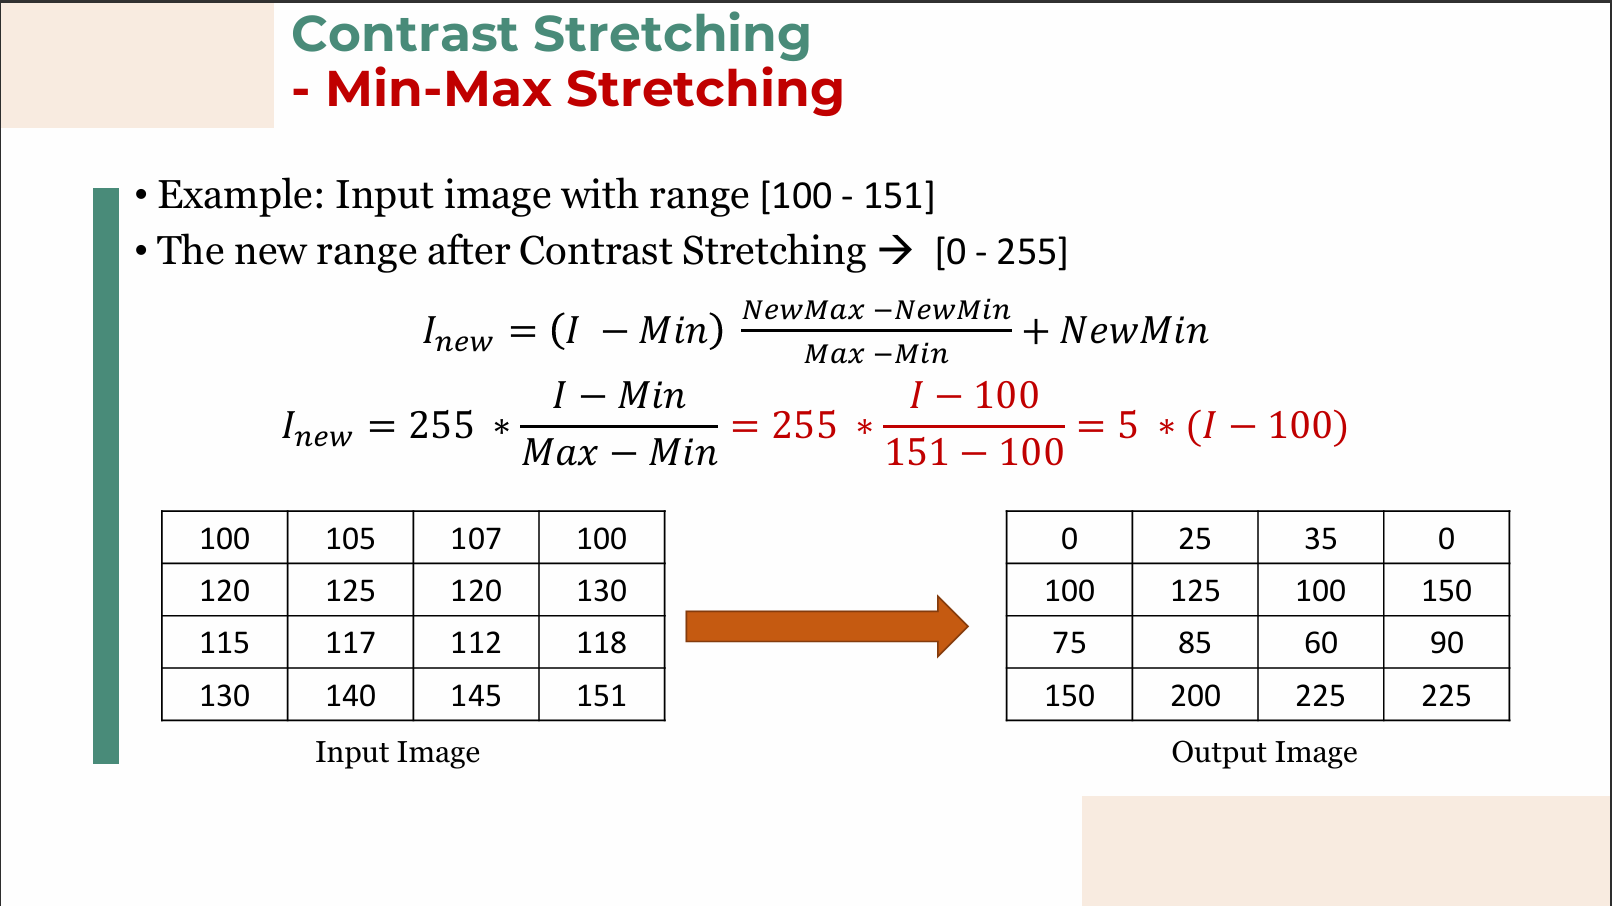
You have captured an image, but due to poor illumination, it suffers from low contrast. When you analyze the image histogram, you find that the pixel intensities only range from a minimum of 100 to a maximum of 151 (a very narrow, gray-washed image).
You want to stretch this contrast to fill the standard 8-bit dynamic range, which goes from 0 to 255.
The Formula:
Step 1: Identify your variables
- Min (original minimum): 100
- Max (original maximum): 151
- NewMin (target minimum): 0
- NewMax (target maximum): 255
Step 2: Plug the limits into the scaling factor
Step 3: Create your simplified transformation equation
Now substitute the scaling factor back into the formula. Your specific transformation function for every pixel
Step 4: Test it on specific pixels!
Let's see what happens to the pixels in the original image:
- The darkest pixel (
): (Now pure black) - The brightest pixel (
): (Now pure white) - A mid-tone pixel (
):
Conclusion: By applying this simple linear operation to every pixel, you have successfully stretched the narrow 51-level range into a full 256-level range, significantly enhancing the visual contrast!
Graph meaning
This slide explains a fundamental concept in digital image processing known as a Piecewise Linear Transformation, specifically used for Contrast Stretching.
It shows how you can change the brightness and contrast of an image by mapping the original pixel values (input) to new pixel values (output) using a mathematical graph.
Here is a breakdown of the concepts shown on the slide:
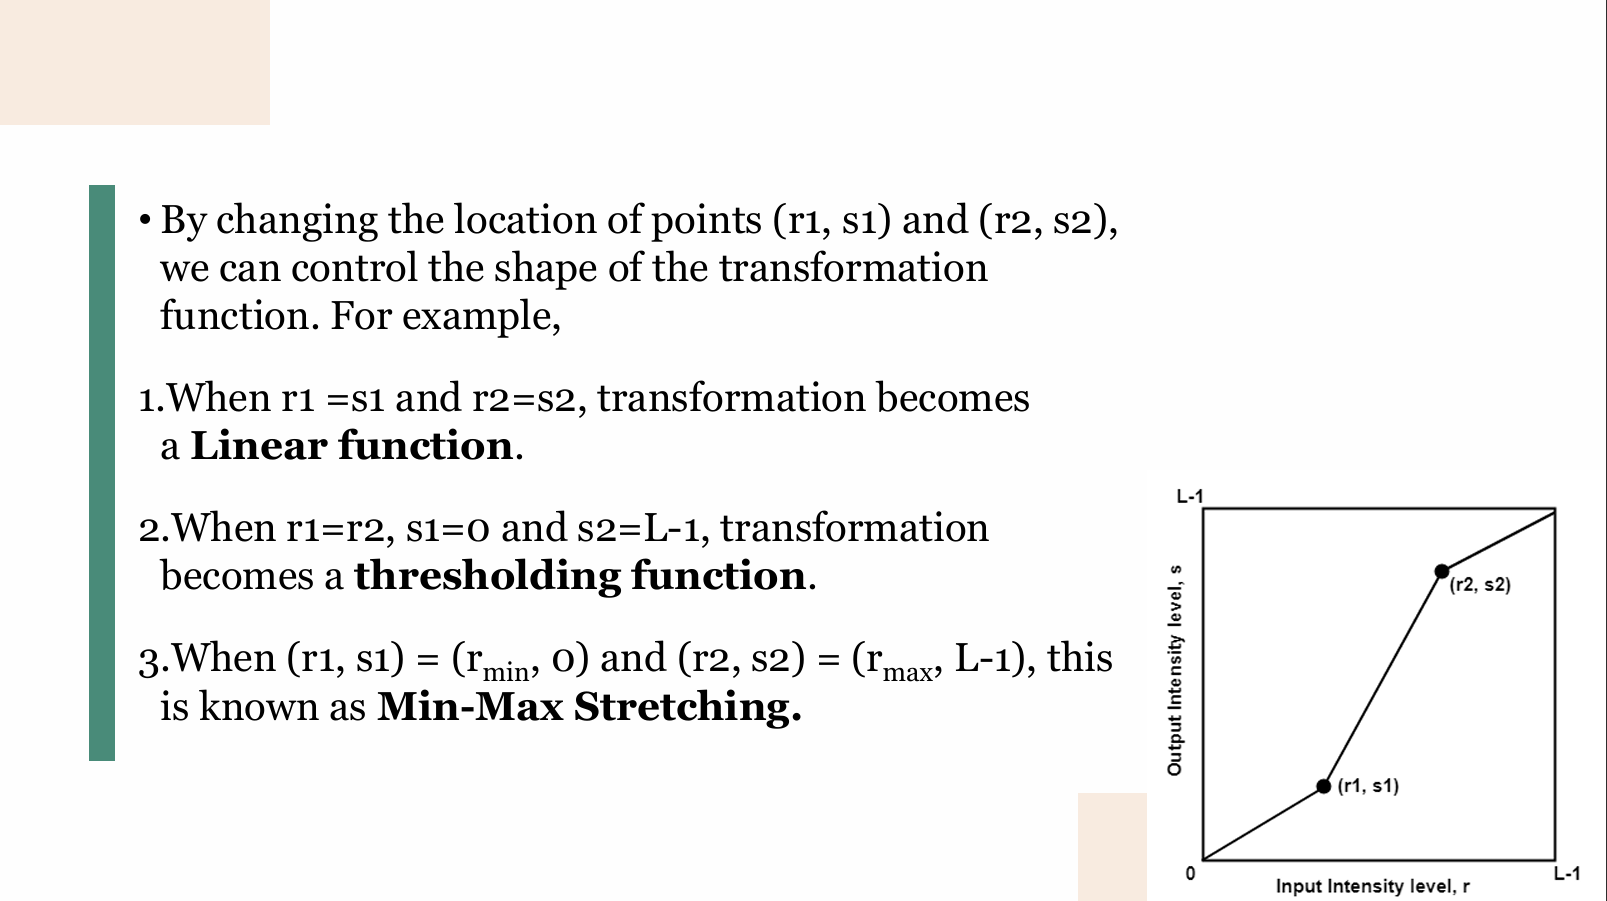
The Basics of the Graph
- X-axis (Input Intensity level,
): Represents the original pixel values of your image. It ranges from (pure black) to (pure white). For a standard 8-bit image, is 255.
- Y-axis (Output Intensity level,
): Represents the new pixel values after the transformation.
- The Control Points
and : These are the "hinges" of the line. By moving these two points around the graph, you alter the shape of the line, which completely changes how the image's contrast is manipulated.
The Three Scenarios Explained
1. Linear Function
-
What the slide says: When
and . -
What it means: If the
and coordinates are identical for both points, the points fall perfectly on a straight 45-degree diagonal line going from to . In this case, every input pixel maps to the exact same output pixel ( ). -
Result: The image doesn't change at all. This is called an "identity transformation."
2. Thresholding Function
-
What the slide says: When
, , and . -
What it means: If
and are the same, the middle section of the line becomes perfectly vertical. Because is at the very bottom (0) and is at the very top ( ), it creates a hard cutoff. Any input pixel value below that vertical line becomes pure black ( ), and any value above it becomes pure white ( ). -
Result: This turns a grayscale image into a completely binary (black and white only) image. It's often used to separate objects from a background.
3. Min-Max Stretching
-
What the slide says: When
and . -
What it means: Imagine an image that looks washed out because its darkest pixel isn't truly black (let's say
is 50) and its brightest pixel isn't truly white (let's say is 200). This transformation takes that lowest existing value ( ) and forces it down to (pure black). It takes the highest existing value ( ) and forces it up to (pure white). -
Result: It stretches out the intermediate pixel values to fill the entire available dynamic range, making darks darker, lights lighter, and significantly improving the overall contrast of a dull image.